

Introduction
Capital project cost estimates always contain uncertainty.
Even well-developed estimates can be affected by many unpredictable factors, including:
- engineering design maturity
- labor productivity variability
- material price fluctuations
- weather impacts
- schedule delays
Traditional contingency methods often apply simple percentage allowances, which may not fully reflect the complexity of project risk.
Large capital projects increasingly rely on probabilistic risk analysis to understand potential cost outcomes.
One of the most widely used techniques for this purpose is Monte Carlo Simulation.
Monte Carlo simulation allows project teams to model uncertainty and generate probability-based cost forecasts, helping decision-makers determine appropriate contingency levels and realistic project budgets.
What Is Monte Carlo Simulation?
Monte Carlo simulation is a statistical modelling technique that analyzes uncertainty by running thousands of possible project scenarios based on probability distributions.
Instead of producing a single cost estimate, the simulation generates a range of potential outcomes.
This enables project teams to evaluate:
- the probability of different project costs
- the likelihood of cost overruns
- the contingency required to achieve a desired confidence level
In large infrastructure and industrial projects, Monte Carlo analysis is often integrated into risk-based cost estimating frameworks.
Why Monte Carlo Simulation Is Used in Cost Estimating
Traditional cost estimates are typically deterministic—they produce a single number representing the expected project cost.
However, real projects rarely follow a single predictable path.
Costs can vary due to:
- unexpected site conditions
- supply chain disruptions
- engineering changes
- contractor productivity variation
Monte Carlo simulation helps project teams:
- quantify uncertainty in cost estimates
- model the impact of project risks
- determine risk-based contingency allowances
- support informed investment decisions
This probabilistic approach is commonly applied to Class 3 and Class 2 estimates, where enough project information exists to analyze risk in detail.
Key Inputs Required for Monte Carlo Cost Simulation
A Monte Carlo cost model typically requires three main inputs.
Base Cost Estimate
The starting point for a simulation is a deterministic base estimate.
This estimate is usually developed using methods such as:
- bottom-up estimating
- parametric estimating
- historical cost benchmarking
The base estimate represents the expected cost of the defined project scope before risk adjustments.
Risk Register
A project risk register identifies uncertainties that may affect cost outcomes.
Typical risks include:
| Risk Example | Description |
|---|---|
| Geotechnical conditions | Unknown soil or rock conditions |
| Design changes | Scope modifications during engineering |
| Material price volatility | Steel or concrete cost fluctuations |
| Labor productivity variation | Workforce efficiency differences |
Each risk is evaluated using:
- probability of occurrence
- potential cost impact
These inputs form the basis for probabilistic modelling.
Probability Distributions
Unlike deterministic estimates, Monte Carlo simulations use probability distributions to represent uncertain variables.
Common distributions include:
| Distribution Type | Typical Use |
|---|---|
| Triangular distribution | When minimum, most likely, and maximum values are known |
| Normal distribution | For symmetrical uncertainty |
| Lognormal distribution | For skewed cost risks |
These distributions define the range of possible outcomes for each uncertain variable.
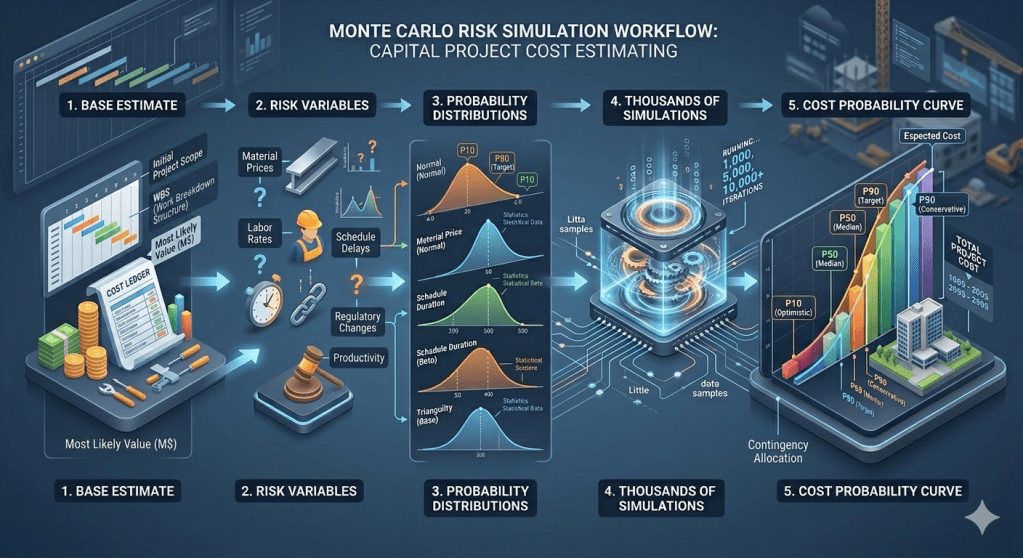
How Monte Carlo Simulation Works
Monte Carlo simulation works through repeated random sampling from probability distributions.
The typical process involves the following steps.
Step 1 — Define the Base Estimate
The model begins with the deterministic cost estimate.
Step 2 — Identify Uncertain Variables
Project cost elements that may vary are identified.
Examples include:
- construction productivity
- equipment costs
- commodity prices
- schedule delays
Step 3 — Assign Probability Distributions
Each uncertain variable is represented by a probability distribution.
Step 4 — Run Simulation Iterations
The model randomly samples from each distribution and calculates a total project cost scenario.
This process is repeated thousands of times.
Step 5 — Generate Cost Distribution
After many iterations, the simulation produces a distribution of total project cost outcomes.
This distribution shows the probability of different cost levels.
Understanding Monte Carlo Simulation Results
The output of a Monte Carlo simulation is typically presented as a probability distribution of project cost outcomes.
Several key metrics are commonly used to interpret the results.
P50 Cost Estimate
The P50 estimate represents the cost with a 50% probability of being exceeded.
This value corresponds to the median cost outcome.
Interpretation:
- 50% chance the project will cost more than P50
- 50% chance the project will cost less than P50
P80 Cost Estimate
The P80 estimate represents a cost level with an 80% probability that the project will not exceed it.
Many organizations use the P80 value as a funding target.
This level provides greater confidence that the project budget will be sufficient.
Cost Probability Curve
Monte Carlo results often produce a cumulative probability curve.
This curve allows decision makers to understand:
- the likelihood of different cost outcomes
- the range of potential project costs
- the contingency required for different confidence levels

Example: Monte Carlo Analysis for an Infrastructure Project
Consider a highway construction project with a deterministic base estimate.
Base Estimate
Base Cost Estimate = $300M
Identified Risks
| Risk | Description |
|---|---|
| Geotechnical conditions | Potential rock excavation |
| Material price volatility | Steel price changes |
| Schedule delays | Weather disruptions |
A Monte Carlo simulation is performed with 10,000 iterations.
Simulation Results
| Metric | Result |
|---|---|
| P50 Cost Estimate | $330M |
| P80 Cost Estimate | $360M |
Interpretation:
- The median cost outcome is $330M.
- Setting a project budget at $360M provides an 80% probability that the project will not exceed its budget.
The difference between the base estimate and P80 represents the risk-based contingency allowance.
Advantages of Monte Carlo Simulation
Monte Carlo simulation provides several advantages in project cost management.
Quantifies Cost Uncertainty
Instead of relying on assumptions, the simulation calculates probability-based cost outcomes.
Determines Risk-Based Contingency
Monte Carlo results help determine appropriate contingency levels based on confidence targets.
Supports Investment Decision Making
Executives can evaluate the risk profile of major capital investments before approving funding.
Improves Budget Reliability
Projects using probabilistic estimates often produce more reliable budgets.
Limitations of Monte Carlo Analysis
Despite its benefits, Monte Carlo simulation has several challenges.
Dependence on Risk Data
Poor risk identification or inaccurate assumptions can produce misleading results.
Model Complexity
Developing realistic simulation models requires specialized knowledge.
Tool Requirements
Monte Carlo analysis often requires specialized software such as:
- risk analysis platforms
- project controls tools
- statistical modelling software.
Best Practices for Monte Carlo Cost Analysis
Experienced project risk teams follow several best practices.
| Best Practice | Benefit |
|---|---|
| Develop a comprehensive risk register | Ensures all major risks are captured |
| Use realistic probability distributions | Improves model accuracy |
| Validate assumptions with project experts | Reduces bias |
| Integrate cost and schedule risk analysis | Improves realism |
These practices improve the credibility of probabilistic cost estimates.
Key Takeaways
- Monte Carlo simulation is a powerful technique for probabilistic cost estimating.
- It models project uncertainty by running thousands of possible scenarios.
- The simulation produces probability-based metrics such as P50 and P80 cost estimates.
- These results help determine risk-based contingency allowances.
- Monte Carlo analysis is widely used in large infrastructure, mining, and energy projects.

Leave a comment